RNA Expression Profiling to Discover N-Responsive Genes
Our initial approach to identifying "Nitrogenes" is to compare gene expression and physiological traits of maize germplasm grown with different levels of N fertility. Maize NUE is best studied in hybrids (the cross of two inbred parents), because N responses are greater in hybrids and hybrids are what farmers grow. Our comparisons focus on hybrids that have the inbred line B73 as one parent, because the B73 line is the focus of the maize genome sequencing effort. We are using four distinct sets of germplasm in these comparisons:
- B73 x Mo17 hybrid, which is representative of hybrids grown in the U.S. Corn Belt
- Diversity Hybrids, where a set of inbreds selected to represent the range of genetic diversity in maize are crossed to B73.
- IHP Hybrids, inbreds derived from Illinois High Protein (IHP) crossed to B73. IHP is a strain subjected to more than a century of genetic selection for grain protein concentration, which also has dramatically altered N metabolism in the plant.
- Hybrids from an ongoing breeding program to improve NUE at the International Institute for Tropical Agriculture. These hybrids are adapted to the low fertility soils of West and Central Africa.
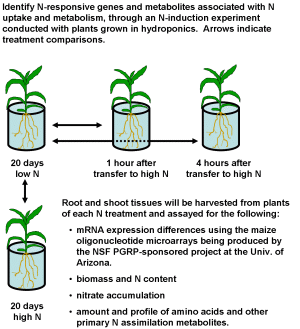
To compare gene expression and physiological responses to N, we grow maize with different levels of N
in both greenhouse hydroponics and field experiments. These environments maximize the probability of
discovering genes associated with NUE.


|
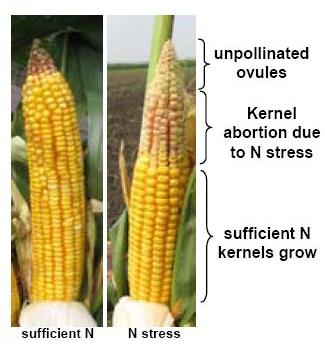
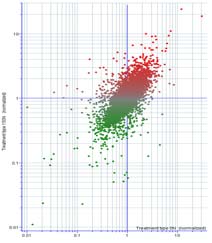
The primary physiological response to N stress that is most highly correlated with grain yield and NUE is a reduction in the number of fully developed kernels, which is most pronounced at the tip of the ear. The tip portion (25%) of developing earshoots was sampled from B73 x Mo17 hybrid plants grown in the field either with or without supplemental N. mRNA isolated from these tissues was hybridized to microarrays produced by the Maize Oligonucleotide Microarray Project at the University of Arizona. ~ 9,000 features passed quality check for both N treatments, where signal intensities for both dyes was above background on all eight replicate slides. 326 features show statistically significant expression differences in response to N
|
||||||||||||||||||||||||

|
|||||||||||||||||||||||||
|
|||||||||||||||||||||||||


